
A frequency chart and a prediction are two different objects, yet half the lottery advice online treats them as the same thing. One is an honest record of which EuroMillions balls have already turned up; the other is a promise about tonight that nobody can keep. Build the first if you fancy some real probability analysis. Treat it as the second and you have wandered into the most common myth in lottery strategy.
Here is the correction, stated plainly before we build anything: a frequency chart cannot tell you what comes next, because the draw has no memory of what it did last week. What the chart can do is show you, in your own handwriting, exactly how randomness behaves over a few months — and that turns out to be far more useful than a fake edge. Treat it as the honest, data-grounded alternative to chasing hot and cold numbers, and it shows you what the historical record actually holds, not what hopeful players project onto it.
Cillian, who teaches PE down the corridor from me, is my reliable test for whether a statistics explanation actually lands with someone who never enjoyed maths. When I called the chart "a diary of the draw, not a forecast," he got it in one. So that is the frame for everything below.
Step One — Pull a Sample Worth Trusting
Every chart starts with data, and the size of your sample decides whether the chart means anything at all. Look at the last five draws and you are staring at noise. Pull twenty years and you are reading ancient history that says little about the current run. A sensible middle is the last six months — somewhere around fifty draws if you log both the Tuesday and the Friday results.
Right then, the schedule matters here because it sets your pace. EuroMillions draws take place every Tuesday and Friday evening at roughly 20:00 GMT — 21:00 in Paris — with UK ticket sales closing at 19:30 on draw nights. Two draws a week is why six months gives you a sample worth tallying rather than a scatter of stray results.
For the raw numbers, go to the National Lottery's official site or a trusted public lottery database and copy down every draw: the five main numbers and the two Lucky Stars. Writing them out by hand, rather than letting a screen scroll past, is what makes the probability theory feel real — there is something about noting that a number has gone missing for twelve draws that no flickering app quite matches.
Accuracy is the part people skip, and it is the part that bites them. A single mistyped number quietly bends your whole frequency distribution out of shape, the way one wrong figure throws off a class set of marks. Roisin, a reader who emails roughly once a month, keeps her own draw-tracking spreadsheet and sends it over so we can line her counts up against mine — twice now that cross-check has caught a slip one of us made. A bigger, cleaner sample beats a small, tidy-looking one every time.
Build the Grid Without Mixing the Pools
Setting up the grid is the easy bit. In a spreadsheet, list the numbers 1 to 50 down one column and tally each appearance in the next; give the Lucky Stars, 1 to 12, their own separate box. The separation is not cosmetic. The main numbers and the Lucky Stars are drawn from different machines, so a number running hot in the main pool tells you nothing about its twin among the stars.
When I put together my 2026 update for testing AI lottery patterns, the mixed-pool mistake was the one I saw most. People merge the two sets, work out a percentage off the combined total, and end up with figures that look precise and mean nothing. Keep the pools apart and the rest of the chart stays honest.
How Do You Actually Tally the Draws?
The tallying itself is three small habits, not a system. First, go draw by draw and add a mark each time a number appears — I still use the old four-lines-and-a-strike method, which is oddly calming. Second, once you have around fifty draws logged, turn each count into a rough share of the total, so you can compare numbers fairly across different stretches of time. A number that shows up in roughly one draw in ten is sitting exactly where chance predicts; that even, boring baseline is the thing you measure everything else against.
Third comes the gap — what I call the truancy rate, since old habits die hard. Note how many draws have passed since each number last appeared. Players love an "overdue" number, convinced a long absence means a return is due. The drum does not know it has been away. A gap is a fact about the past, nothing more, and reading it as a forecast is the myth creeping back in through the side door.
Why the Machine Ignores Your Chart
You have your chart. You can see one number has turned up twice as often as another over three months, and it feels like a crack in the wall. This is where the teacher voice comes out. The draw is what we call an independent event, and independent events do not keep score.
Think of a coin. Flip it and get heads ten times running, and the chance of heads on the eleventh flip is still one half — the coin feels no pressure to "owe" you tails. A EuroMillions ball behaves the same way: one drawn last Tuesday has the same chance tonight as one nobody has seen since Christmas. Underneath all of it sit randomness and independence, where each draw stands alone with no memory of the one before.
Over the very long run, the law of large numbers does flatten everything out, but "the long run" can mean tens of thousands of draws. In our small six-month window we get clusters instead, and we christen them patterns when they are really the ordinary ripples of a random walk. Ask a class whether a cloud shaped like a dog means the sky planned a poodle. A frequency chart is, in the nicest way, cloud-watching with a ruler.
Does AI Beat a Notebook?
Plenty of tools now promise to do this counting for you, faster and at scale. I spent six months running their picks beside my own hand tallies — including the head-to-head in my LottoChamp vs Lottery Defeated: Which Algorithm Wins My Notebook Test? write-up — to see whether they found anything I had missed or simply did the same job at speed.
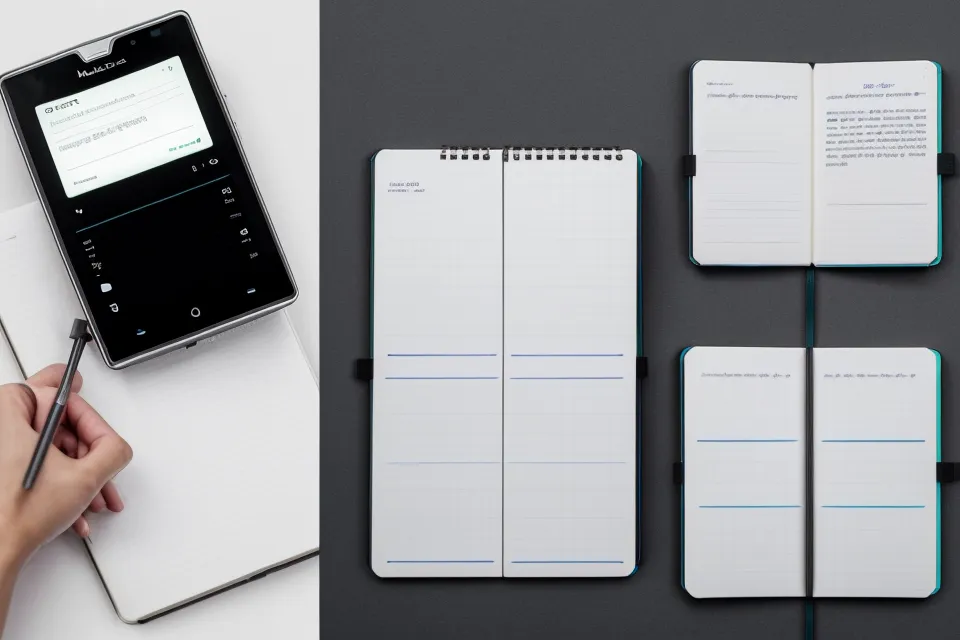
What these tools really do is the same thing the chart does, only wider — they weigh neighbouring numbers and the summed total of a line, not just whether a ball is hot or cold. When I finally laid six months of parallel results on the two screens above my desk, the algorithm's running picks on one and my hand-tallied choices on the other, it sat a fraction ahead, the gap there in plain black and white — and both columns still ended well in the red. It is fair to ask Is Lottery AI Real or Just Better Math?, because these platforms are, underneath the branding, very fast frequency counters bound by the same randomness as my biro.
One stretch I gave up choosing altogether and just hit the Quick Pick terminal on every single purchase for a month — no chart, no thought, pure machine. Nothing changed. The random picks lost at the very same rate as my carefully tallied ones, which is the entire point: the chart was never the thing standing between me and a win, so dropping it cost me nothing but the fun.
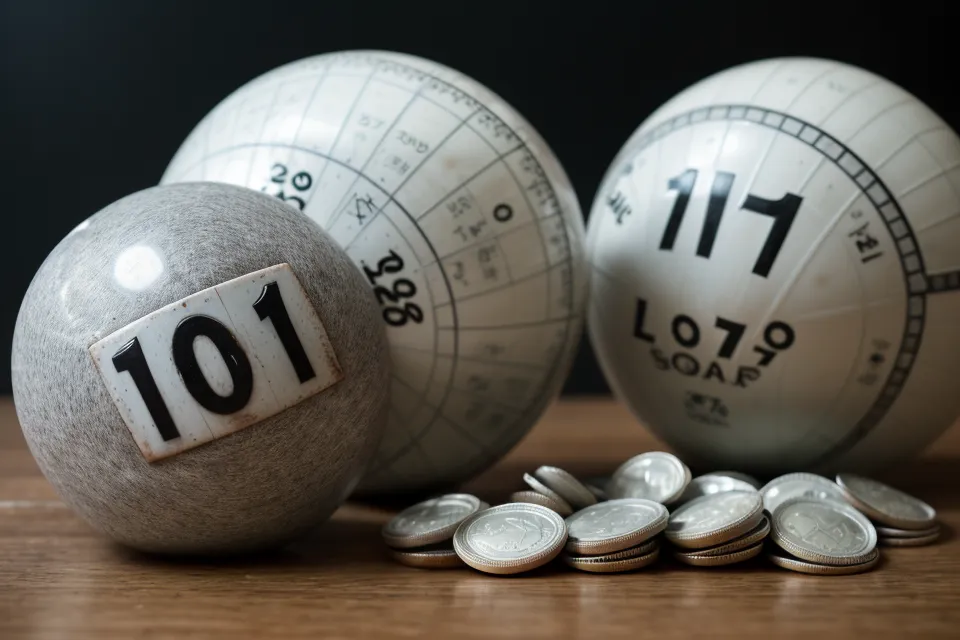
The Real Scale of a EuroMillions Jackpot
It helps to picture what the chart is up against. The odds of the EuroMillions jackpot are about one in 140 million. For a Year 10 class I describe it as picking one exact second out of more than four years — start counting now and you would still be going long after this guide is forgotten.
Set that against a chart where one number shows up half again as often as another, and the so-called edge evaporates. A small frequency difference is real and measurable, yet against that many combinations it is a single drop in the Ship Canal — there, but nowhere near enough to keep the boat afloat. No chart, however neat, shifts the expected value of a ticket; every line you play carries the same small built-in loss.
So Why Build One at All?
If the maths says a chart cannot win, the obvious question is why bother, and there are good answers, none of them about prediction. A chart keeps you off the heavily shared combinations: tens of thousands of people play 1, 2, 3, 4, 5, so on the freak day it lands the prize splits so many ways there is barely a holiday left in it. Spreading your numbers will not improve your odds of winning, but it does protect the size of any win you somehow get.
Tracking your own results does something quieter and more valuable: it makes the loss column impossible to ignore. Watching cold numbers stay cold for a shockingly long time is the best probability lesson going, far better than anything I can chalk up on a board. And once you hold your own data, the online gurus promising a "guaranteed" number tonight become genuinely funny, because the page in front of you shows that guarantees do not live in a drum of plastic balls.
What the Chart Is Actually For
So here is the rule to carry off this page: build the chart, but give it the right job. It is a record, a budget tracker, and a vaccine against lottery nonsense — never a forecast. Update it after each draw if you enjoy the ritual — the copy pinned above my desk in the spare-room study, here in Didsbury, picks up a fresh red-biro mark the evening of every draw — just never let the tidy columns talk you into believing the next draw owes you anything.
I treat my weekly ticket as the cost of a fancy coffee, a small fee for the right to daydream, and the chart simply makes the daydream more interesting. The numbers in your bank account are always worth more attention than the ones you hope will tumble out of a machine in Paris, and a good chart, used honestly, helps you remember exactly that.